Query Telemetry
Detailed timing breakdown and performance analysis
Query Telemetry
Query telemetry provides detailed timing breakdowns for your queries, helping you understand where time is spent and identify performance bottlenecks.
Viewing Telemetry
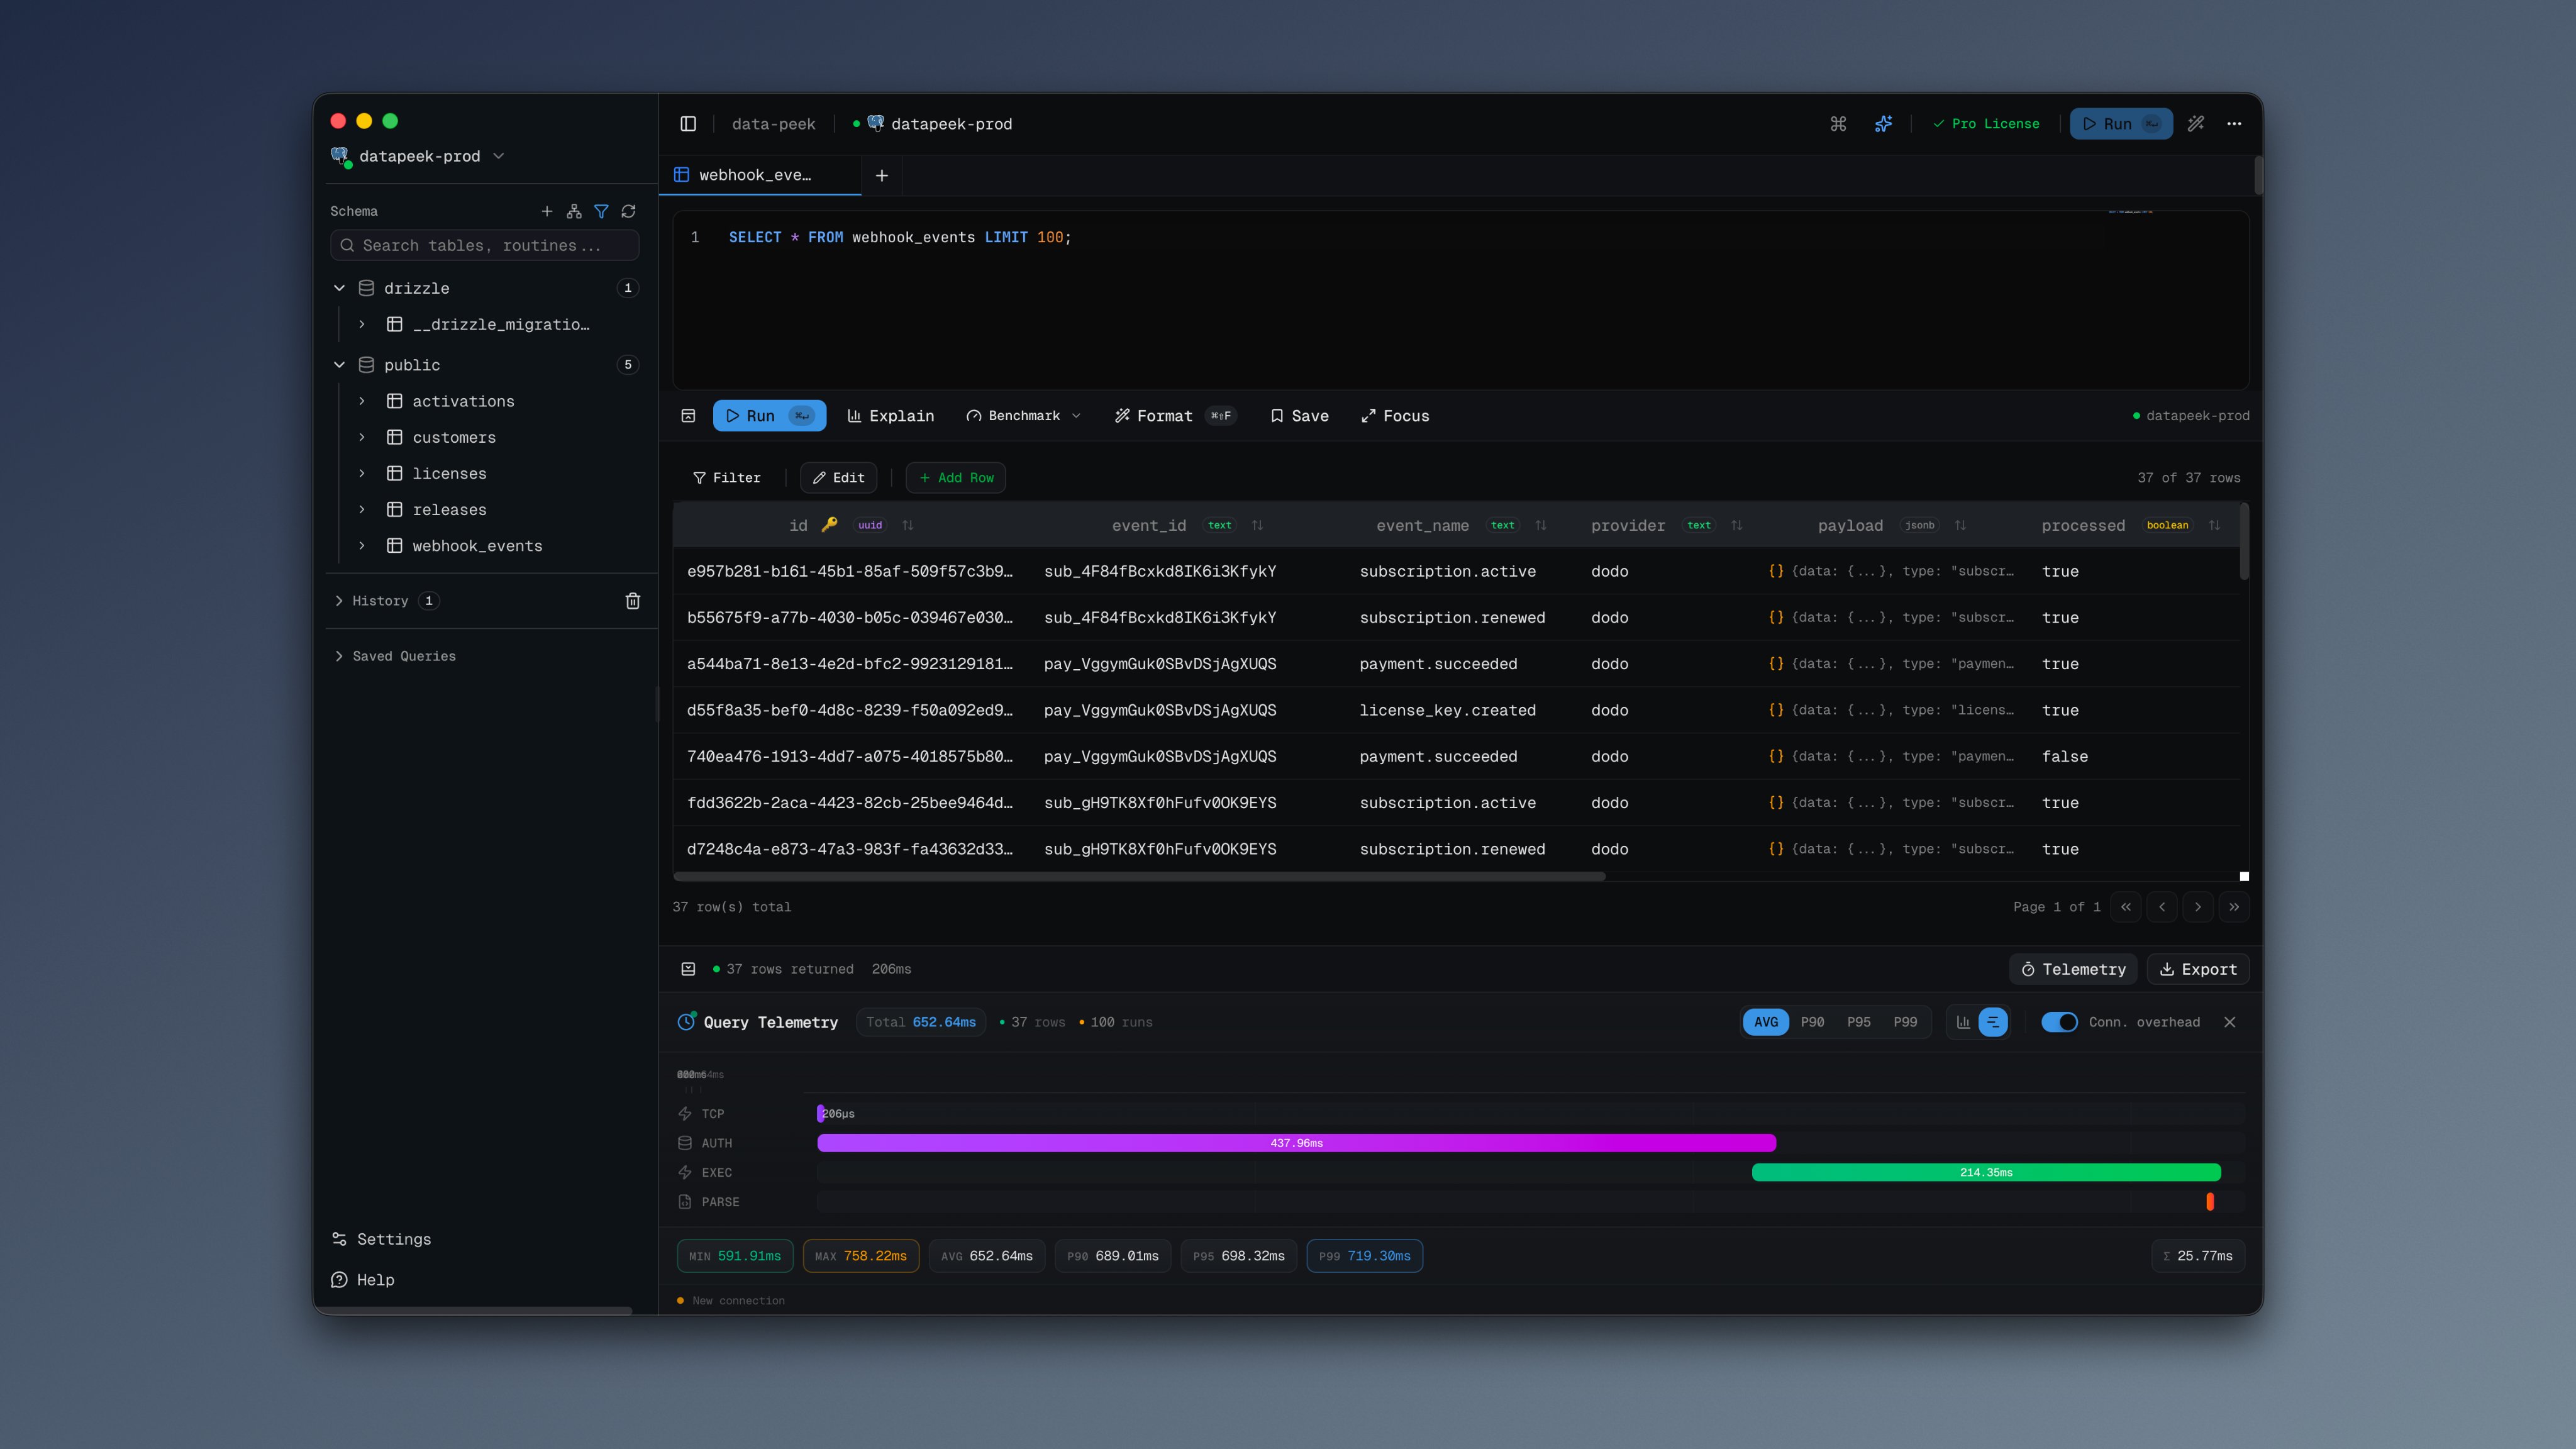
After running a query, click the Telemetry button in the results toolbar to see the timing breakdown.
Timing Phases
Each query is broken down into these phases:
| Phase | Description |
|---|---|
| TCP Handshake | Time to establish TCP connection |
| DB Handshake | Database authentication and protocol setup |
| Network Latency | Round-trip time to the server |
| Query Planning | Time for the database to plan the query |
| Execution | Server-side query execution time |
| Data Transfer | Time to transfer results from server |
| Parse & Decode | Client-side result parsing |
View Modes
Proportional Bars
Shows each phase as a horizontal bar, sized proportionally to its duration. Great for quickly seeing which phase takes the most time.
Timeline Waterfall
Shows phases on a timeline, visualizing how they overlap or occur sequentially. Useful for understanding the query lifecycle.
Connection Overhead Toggle
Enable Connection overhead to include TCP and database handshake times. Disable it to focus only on query-specific timing.
When using connection pooling, you’ll see “Connection pooled” at the bottom, indicating the connection was reused.
Benchmark Mode
For more accurate performance analysis, use Benchmark Mode:
- Click the Benchmark button next to the run button
- The query runs multiple times (default: 10 iterations)
- View statistical analysis of results
Benchmark Statistics
| Metric | Description |
|---|---|
| Min | Fastest execution time |
| Max | Slowest execution time |
| Avg | Average execution time |
| P90 | 90th percentile (90% of queries were faster) |
| P95 | 95th percentile |
| P99 | 99th percentile |
| σ (Std Dev) | Standard deviation |
Percentile Selector
Switch between viewing Avg, P90, P95, or P99 values in the phase breakdown.
Use Cases
Identifying Slow Phases
If Execution is slow:
- Check your query plan (
EXPLAIN ANALYZE) - Add indexes for frequently filtered columns
- Optimize joins
If Data Transfer is slow:
- Reduce result set size with
LIMIT - Select only needed columns instead of
SELECT * - Consider pagination
If Network Latency is high:
- Database server may be geographically distant
- Network congestion issues
- Consider a closer database region
Comparing Query Performance
Use benchmark mode to compare:
- Different query approaches
- Before and after index changes
- Impact of query optimizations
Detecting Connection Issues
High TCP Handshake or DB Handshake times may indicate:
- Network issues
- SSL/TLS overhead
- Authentication delays
- Consider connection pooling
Tips
- Run benchmarks multiple times to account for cache effects
- First query may be slower due to cold cache
- Compare P95/P99 for reliable performance guarantees
- Use the waterfall view to spot sequential bottlenecks