ER Diagrams
Visualize your database schema with interactive entity relationship diagrams
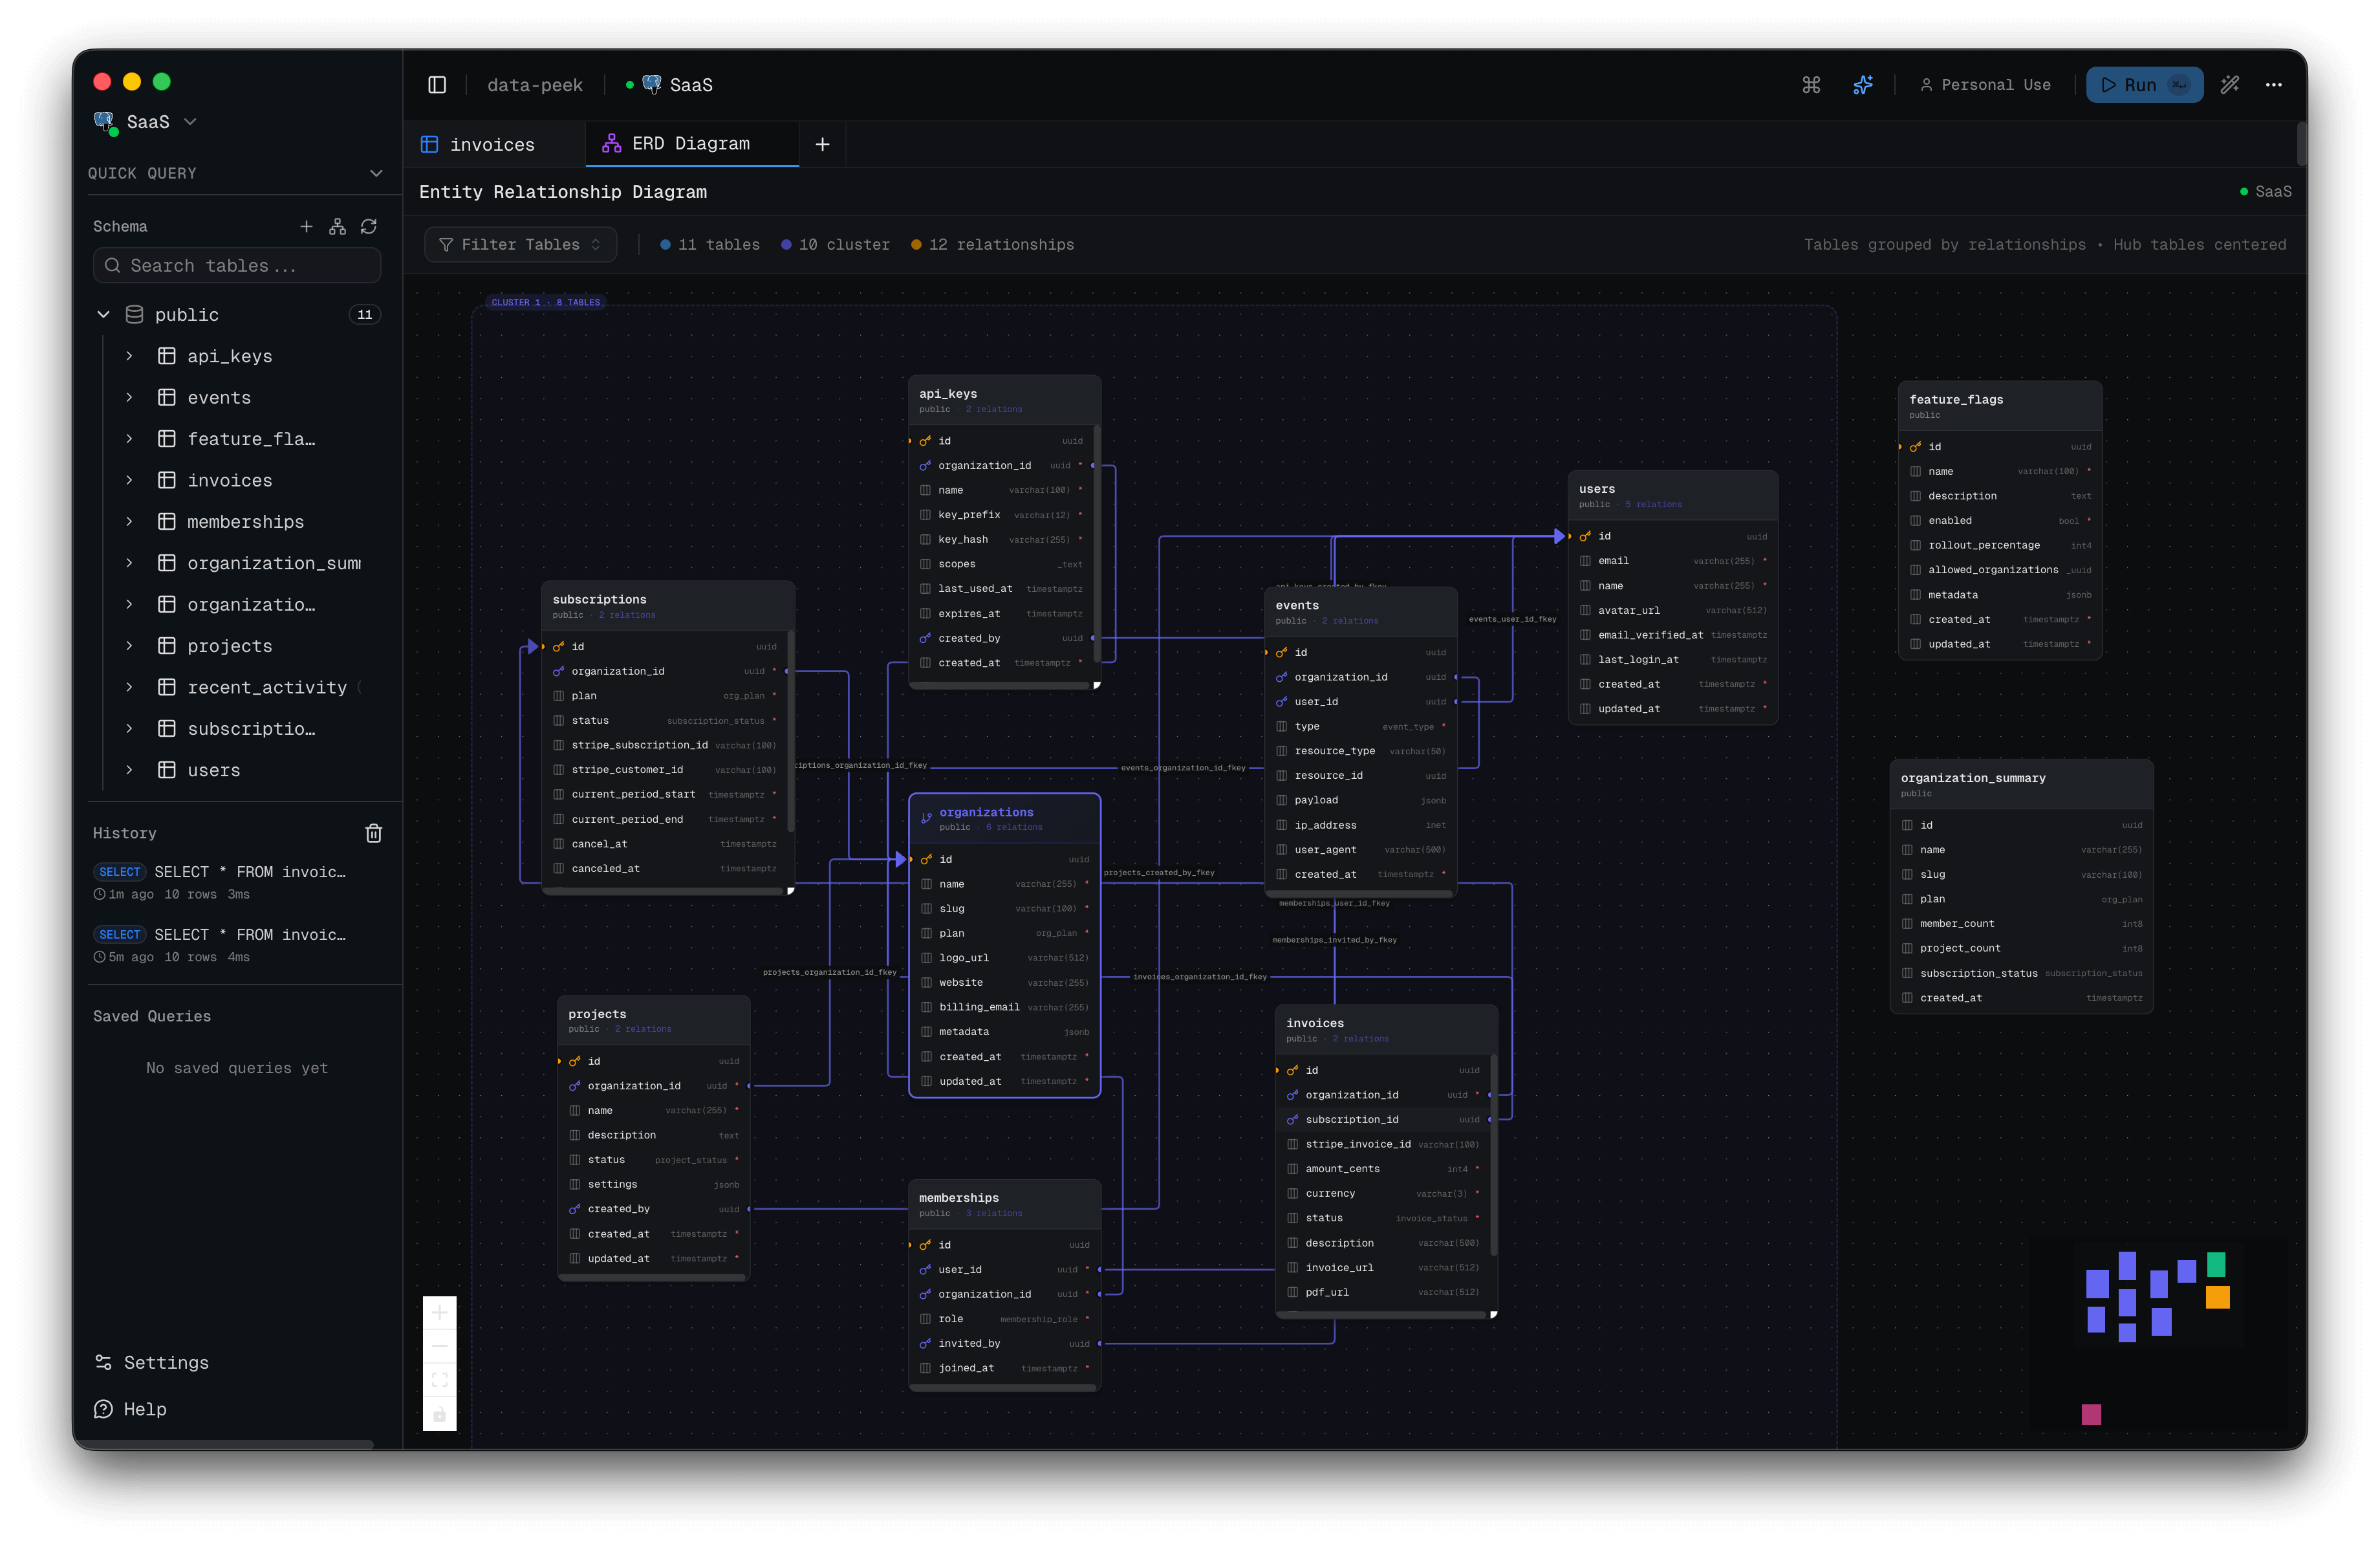
ER Diagrams
data-peek generates interactive Entity Relationship Diagrams to help you understand your database structure.
Opening ERD
- Right-click a schema in the sidebar
- Select View ERD
- An ERD tab opens with all tables in that schema
Or click the ERD icon in the tab bar to open for the current connection.
Diagram Elements
Table Nodes
Each table appears as a node showing:
- Table name (header)
- All columns with data types
- 🔑 Primary key indicator
- 🔗 Foreign key indicator
Relationship Lines
Foreign key relationships appear as connecting lines between tables.
Schema Colors
Tables are color-coded by schema for easy identification in multi-schema databases.
Navigation
Zoom
- Scroll wheel to zoom in/out
- Or use zoom controls in the corner
Pan
- Click and drag the background
- Or use arrow keys
Minimap
The minimap in the corner shows your position in large diagrams. Click to jump to a location.
Interacting with Tables
Select
Click a table to select it (highlighted border).
View Data
Click a table name to open a preview tab with its data.
Search
Use the search box to find specific tables. Matching tables are highlighted.
Layout
Auto Layout
Tables are automatically positioned to:
- Minimize relationship line crossings
- Group related tables together
- Cluster by schema
Manual Positioning
Drag any table to reposition it. Positions are preserved for the session.
Reset Layout
Click the reset button to return to auto-layout.
Full Screen
Click the expand button to view the ERD in full screen mode. Press Escape to exit.
Hub Tables
Tables with many relationships (foreign keys pointing to them) are highlighted as “hub” tables, indicating they are central to your schema design.
Tips
- Large schemas: Use search to find specific tables
- Complex relationships: Zoom in on specific areas
- Understanding structure: Follow relationship lines to trace data flow
- Documentation: Take screenshots for documentation purposes